Production Targets
Production Targets is a tool that users use to visualize specific targets for Production. Users can enter in a Year, Name, and Target and then compare it to previous years. Once Production Targets are entered, users can also view Production Targets on some Production Reports.
Users can enter Production Targets for the entire plant, by Workcenter Type, or by Workcenter. Users can enter in Efficiency Production Targets.
Production Targets can be viewed by navigating to the  tab and clicking on the
 ![]() icon. The
Production Targets screen will be displayed.
icon. The
Production Targets screen will be displayed.
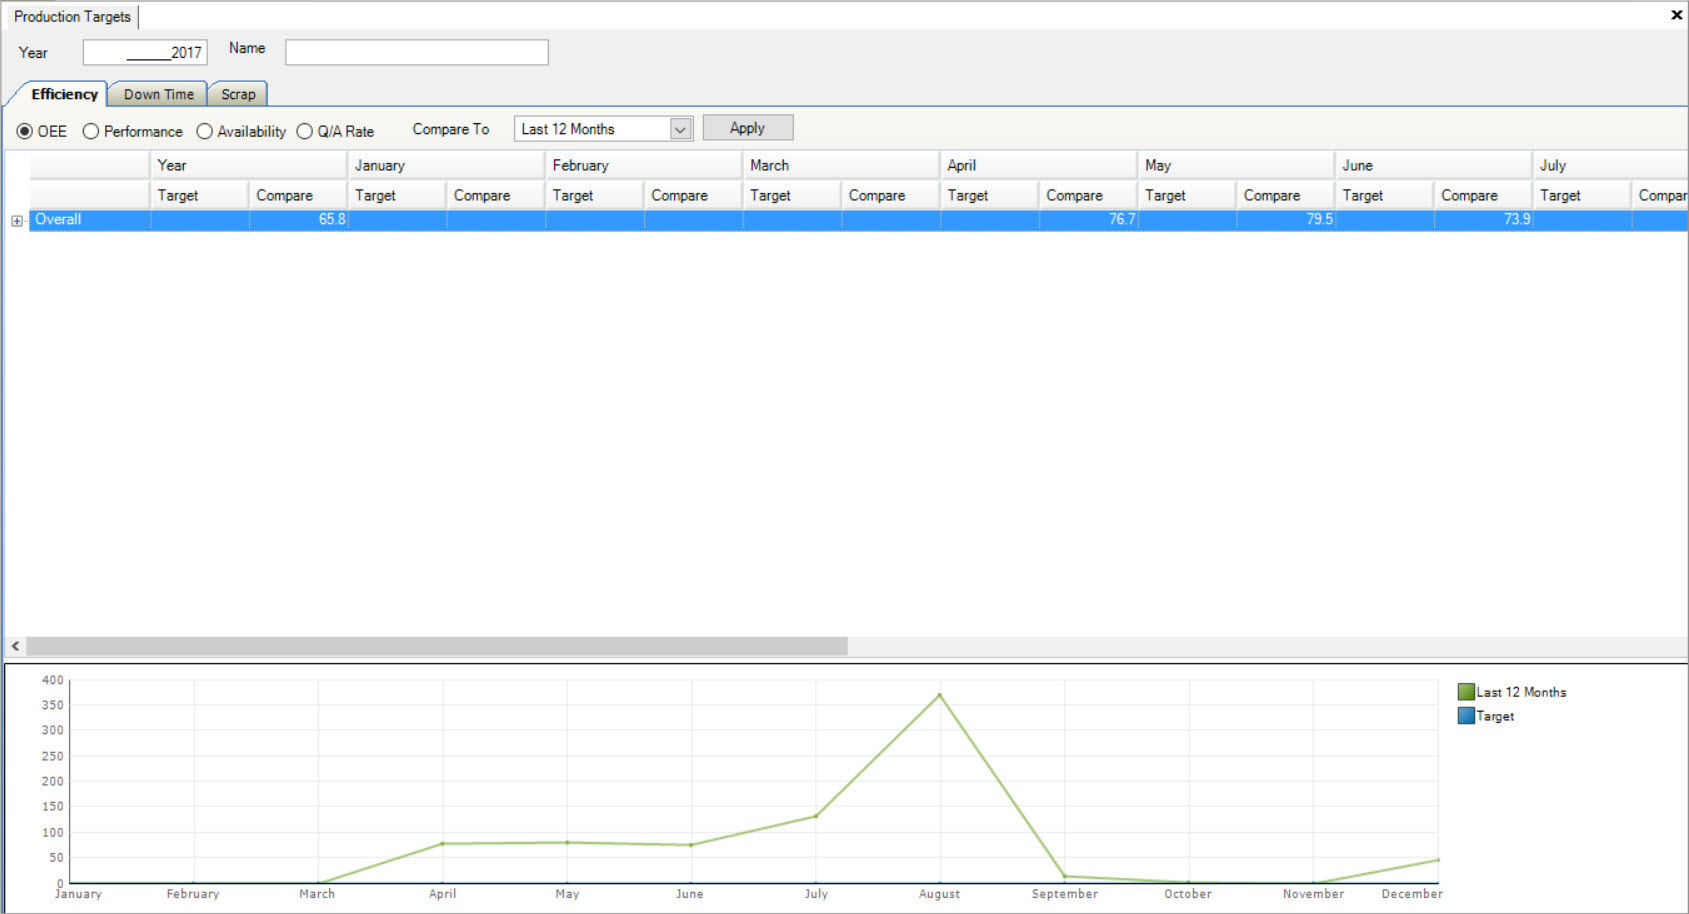
Efficiency Targets
Efficiency Targets on the Production Targets screen can be viewed by clicking on the  tab.
tab.
Efficiency Targets are used to users to compare previous years and/or months of efficiency by Overall, Workcenter Types, and Workcenters.
Viewing Target Information
Efficiency Targets can be viewed by OEE, Performance, Availability, and Q/A Rate.
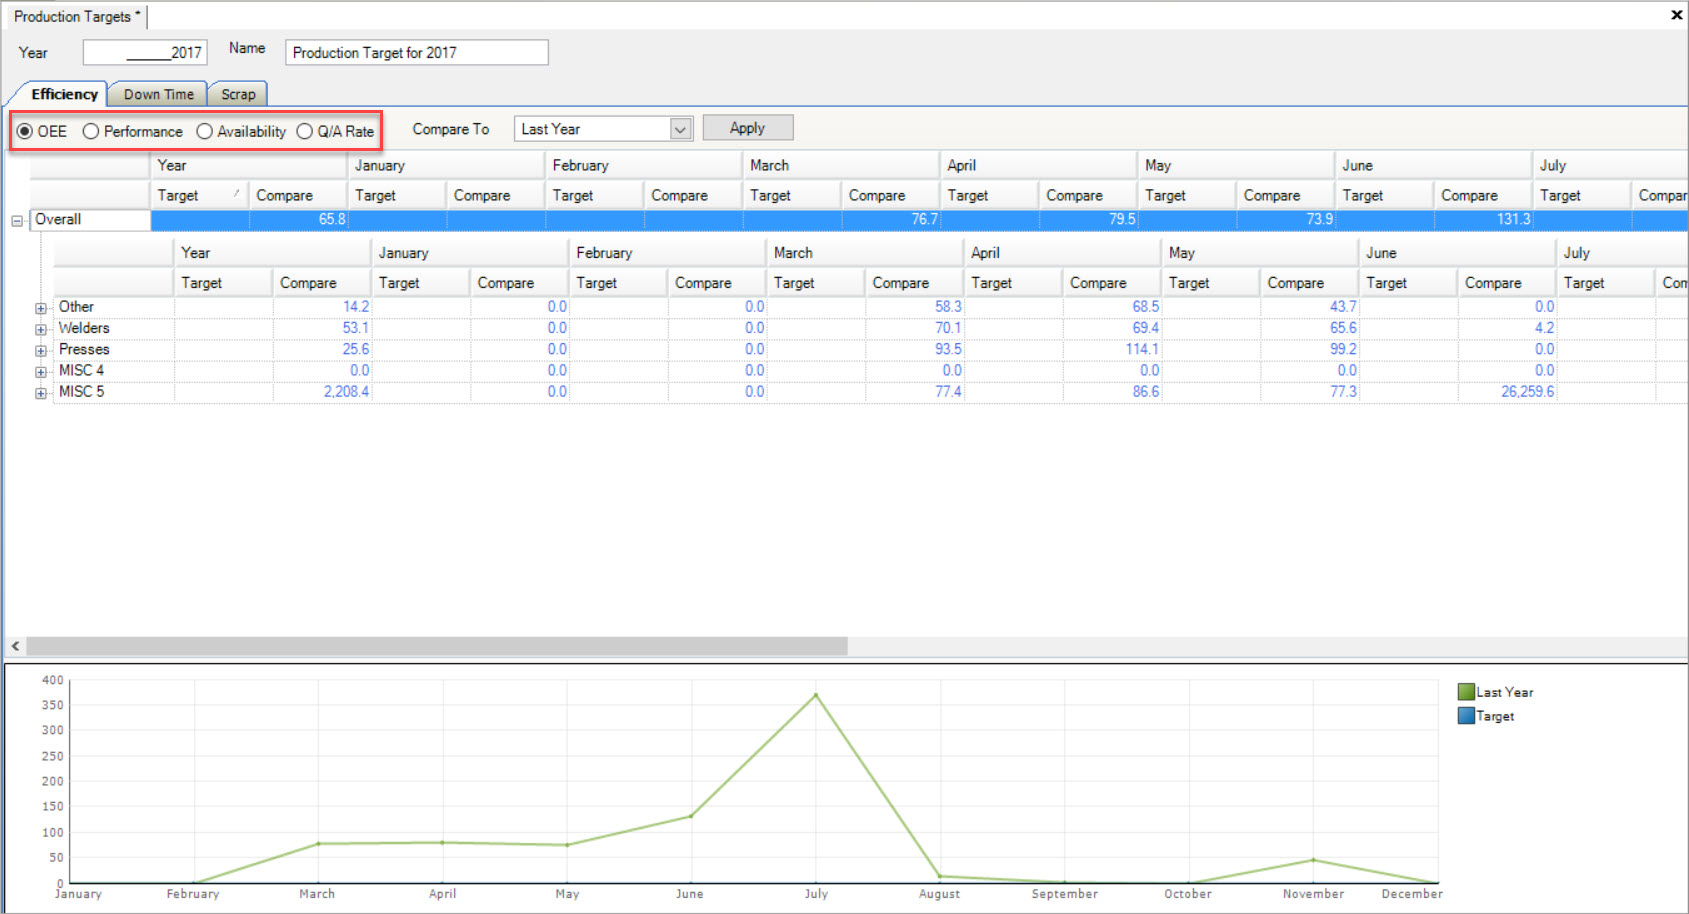
OEE includes Performance, Availability, and Q/A Rate but if users wish to break the Efficiency Target down even more, selecting either Performance, Availability, or Q/A Rate will do that.
Entering in a New Efficiency Target
When entering in a new Efficiency Target, users must select an option to view their Target by. Simply select one of the options: OEE, Performance, Availability, or Q/A Rate.

Once users have selected an option to view the Efficiency Target, use the drop-down menu located beside Compare To and select an option to compare your Target to. Options include
previous Target years created in the system such as the Last 12 Months, This Year, Last Year, and previous years. Once selected, click on the  button.
The Compare column below will be populated with the information in the system for both the Year and Month basis, if the information is available.
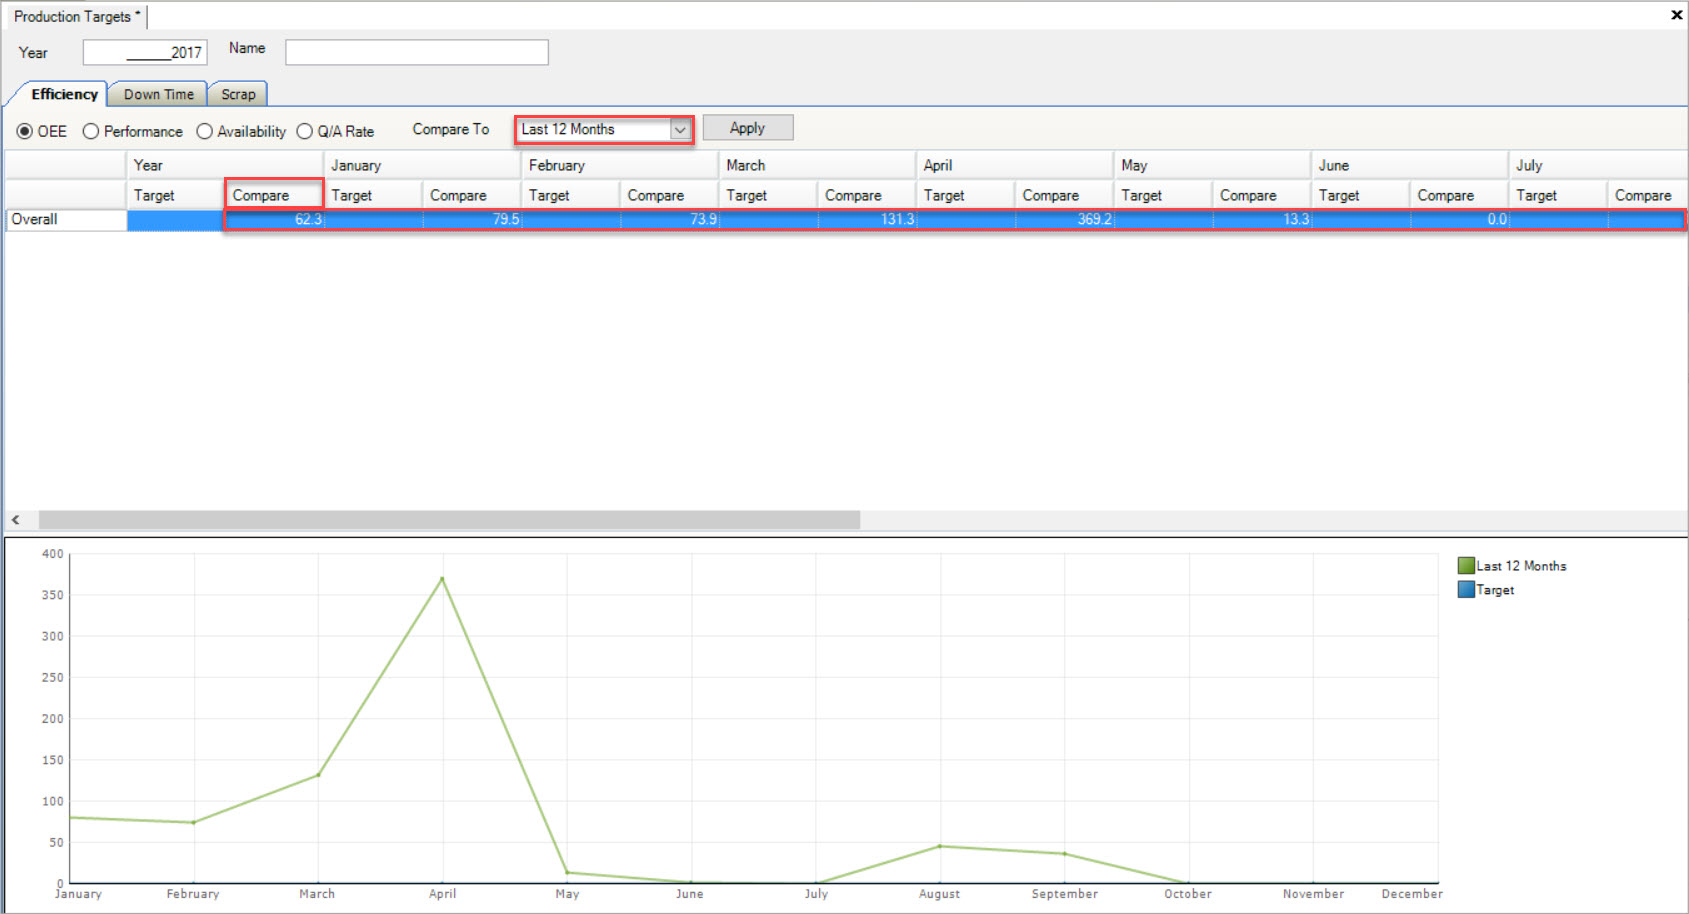
Users then have the option to compare Efficiency Targets by Overall, Workcenter Types, and/or Workcenters.
Overall Targets
To create an Overall Target, users must select one of the options to view the Target by: OEE, Performance, Availability, or Q/A Rate.

Once users have selected an option to view the Overall Efficiency Target, use the drop-down menu located beside Compare To and select an option to compare your Target to. Options
include previous Target years created in the system such as the Last 12 Months, This Year, Last Year, and previous years. Once selected, click on the  button.
The Compare column below will be populated with the information in the system for both the Year and Month basis, if the information is available.

Expanding the plus sign to the left of the Overall row, will display the information by Workcenter Type, and by expanding the Workcenter Type, it will display the information for the individual Workcenters.
To compare Efficiency Targets for these categories overall, the Targets should be entered in, in just the Overall row.
On the graph located at the bottom of the screen, the option that you have selected from the Compare To drop-down menu, will be displayed by a green line.
Overall Targets by Year
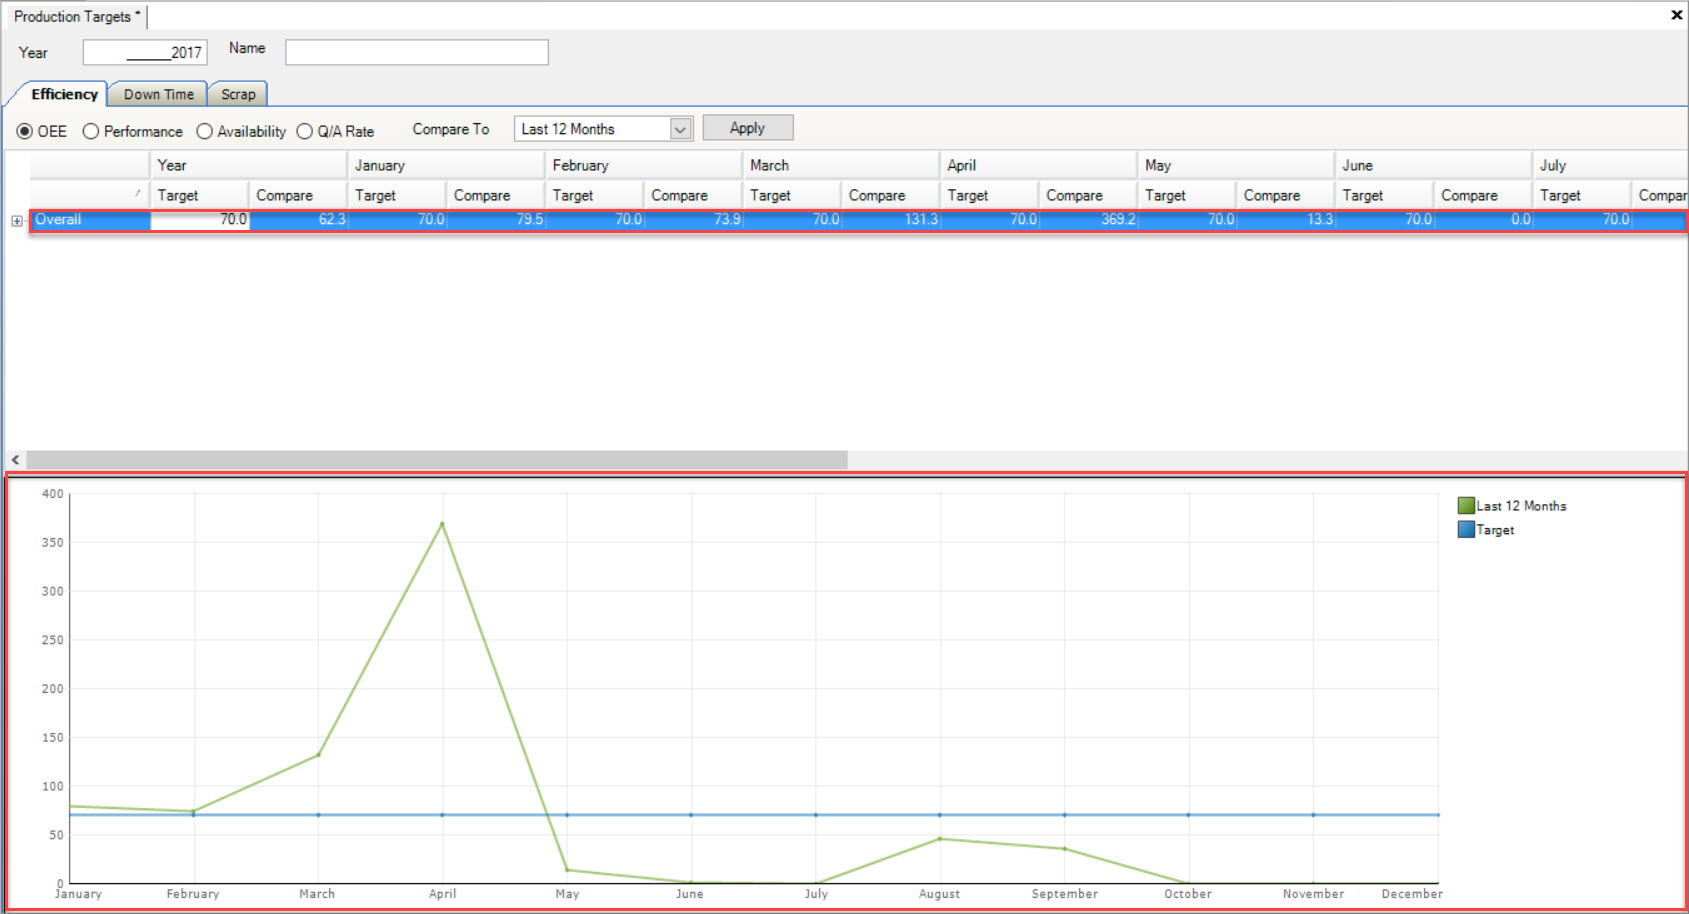
To compare Efficiency Targets Overall by Year, users can enter in a Target in the Target column located below the Year column.
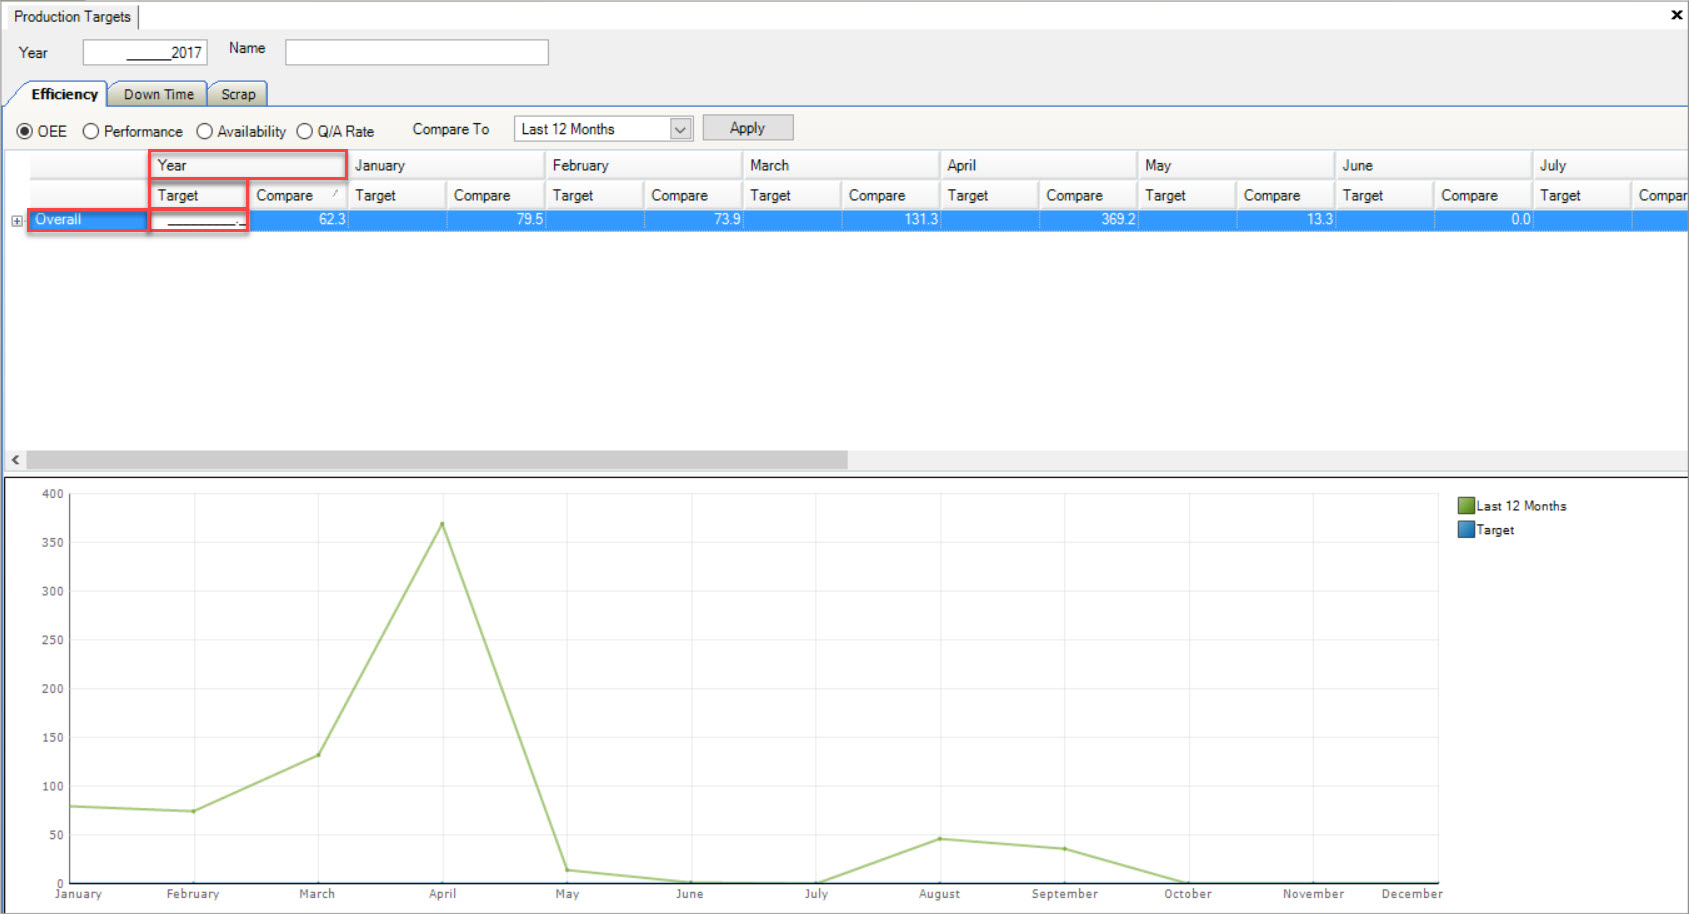
Once the Target has been entered, every Month will default to the same Target.

The graph below will display and compare the Efficiency Target to the Compare To option you selected.
The green line represents the Compare To option and the blue line represents the Target.
Overall Targets by Month
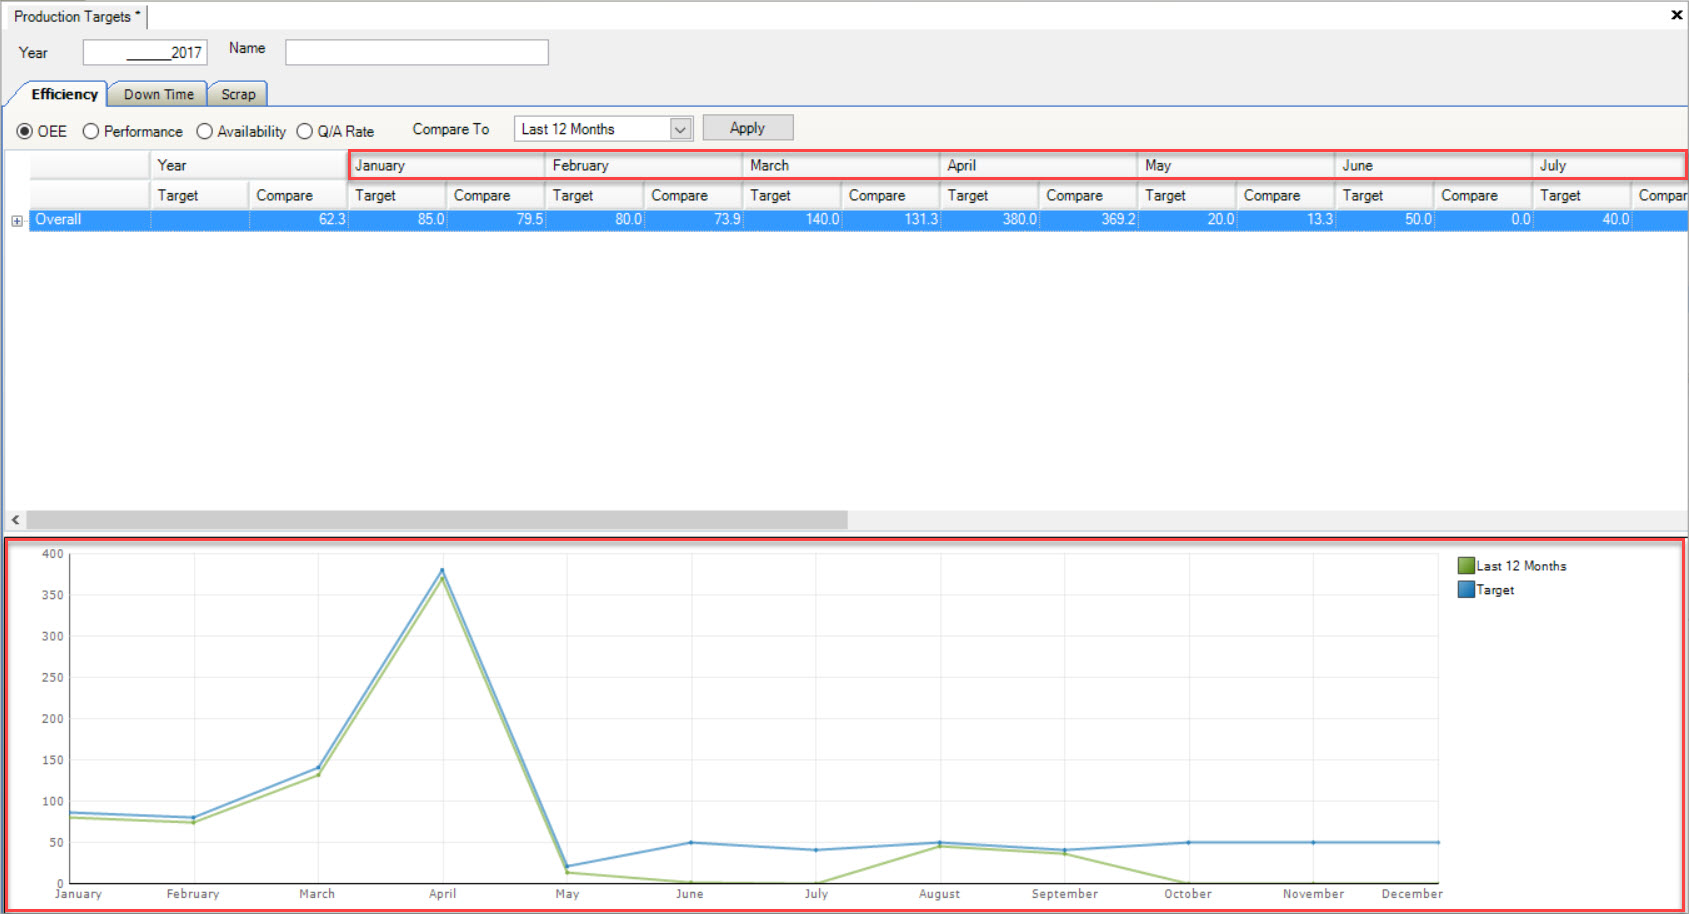
To compare Efficiency Targets Overall by Month, users can enter in a Target specific to each Month, in the Target column located below each Month column.

As each Target for each Month is entered, the graph below will adjust accordingly.
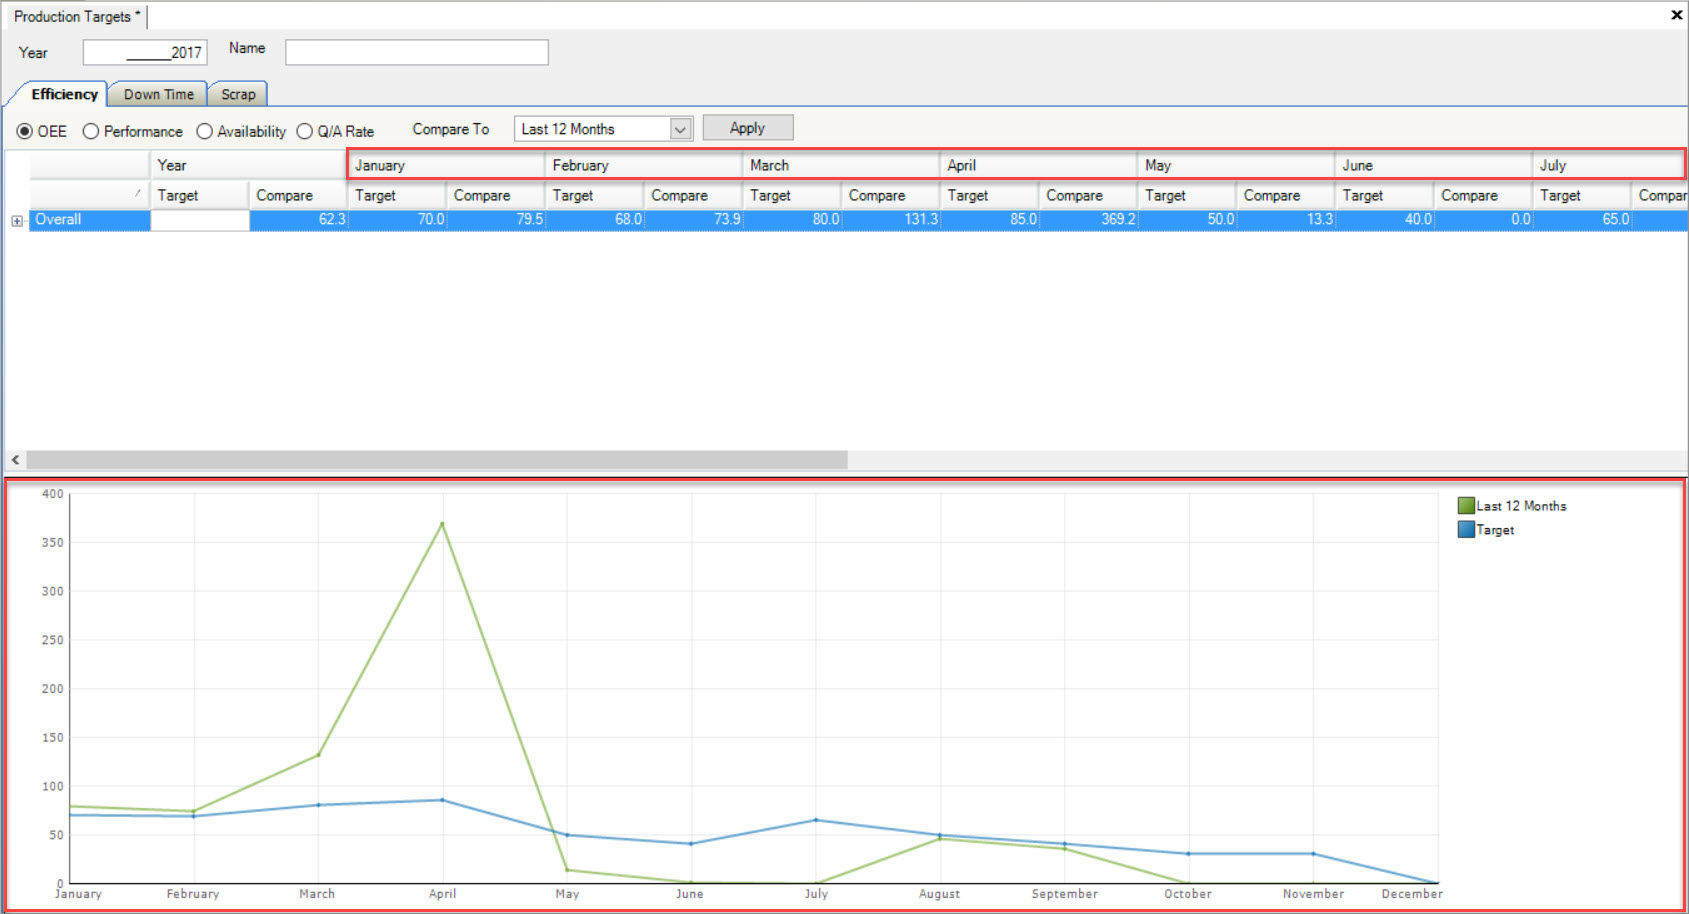
The graph below will display and compare the Efficiency Target to the Compare To option you selected.
The green line represents the Compare To option and the blue line represents the Target.
Targets by Workcenter Type
To create an Efficiency Target by Workcenter Type, users must select one of the options to view the Target by: OEE, Performance, Availability, or Q/A Rate.

Once users have selected an option to view the Overall Efficiency Target, use the drop-down menu located beside Compare To and select an option to compare your Target to. Options
include previous Target years created in the system such as the Last 12 Months, This Year, Last Year, and previous years. Once selected, click on the  button.
The Compare column below will be populated with the information in the system for both the Year and Month basis, if the information is available.
Expanding the plus sign to the left of the Overall row, will display the information by Workcenter Type, and by expanding the Workcenter Type, it will display the information for the individual Workcenters.
To compare Efficiency Targets by Workcenter Type, expand the Overall row once. The available Workcenter Types will be displayed.

On the graph located at the bottom of the screen, the option that you have selected from the Compare To drop-down menu, will be displayed by a green line.
Workcenter Type Targets by Year
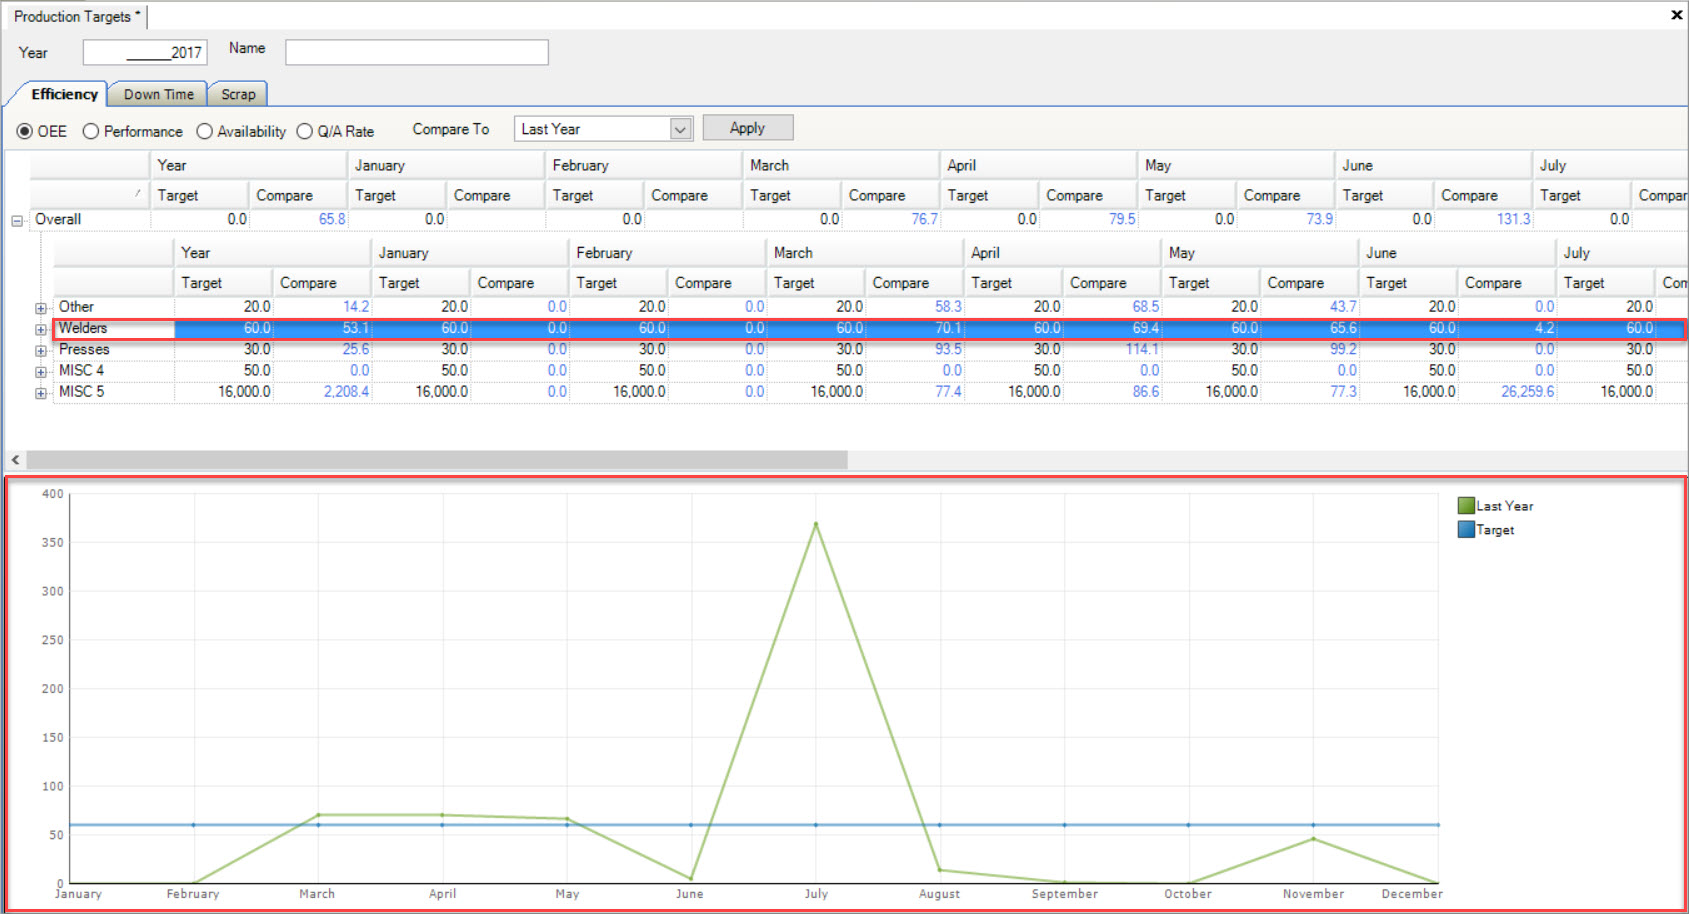
To compare Efficiency Targets by Workcenter Types by Year, users can enter in a Target in the Target column located below the Year column for each available Workcenter Type.
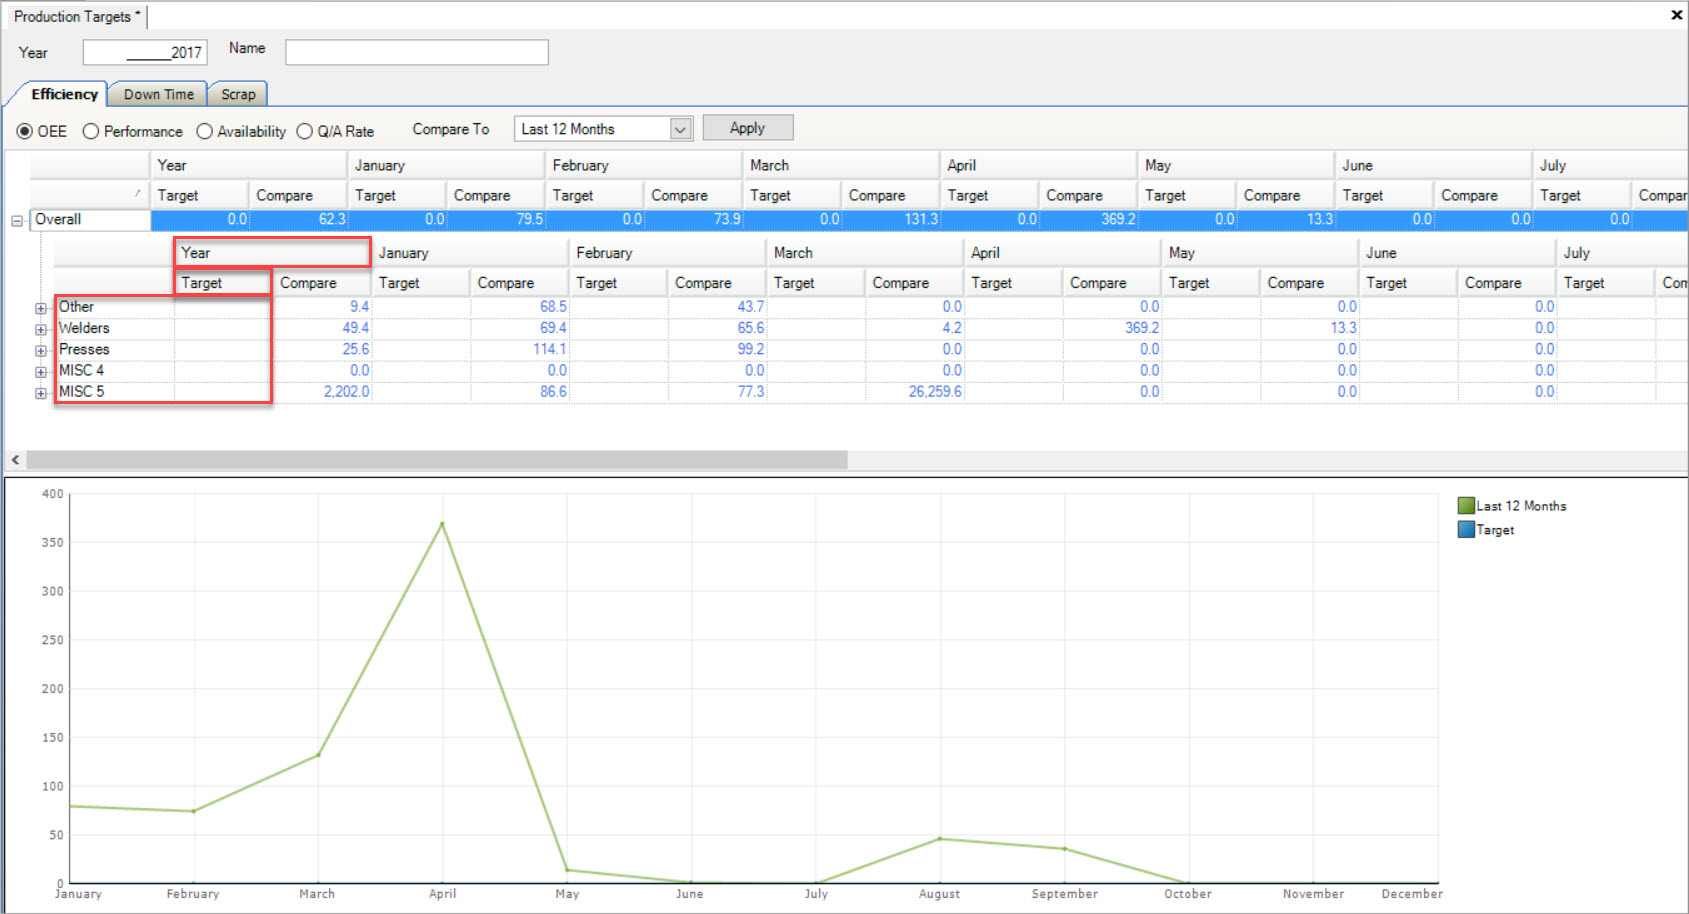
Once the Target has been entered, every Month will default to the same Target that was entered in, in the Target column located below the Year column for each Workcenter Type.

The graph below will display and compare the Efficiency Target to the Compare To option you selected.
The green line represents the Compare To option and the blue line represents the Target.
Note
Users can only view one graph at a time for Workcenter Types.
Workcenter Type Targets by Month
To compare Efficiency Targets by Workcenter Types by Month, users can enter in a Target in the Target column located below each Month for each available Workcenter Type.

Once the Target has been entered in for each Month, the graph below will adjust accordingly.
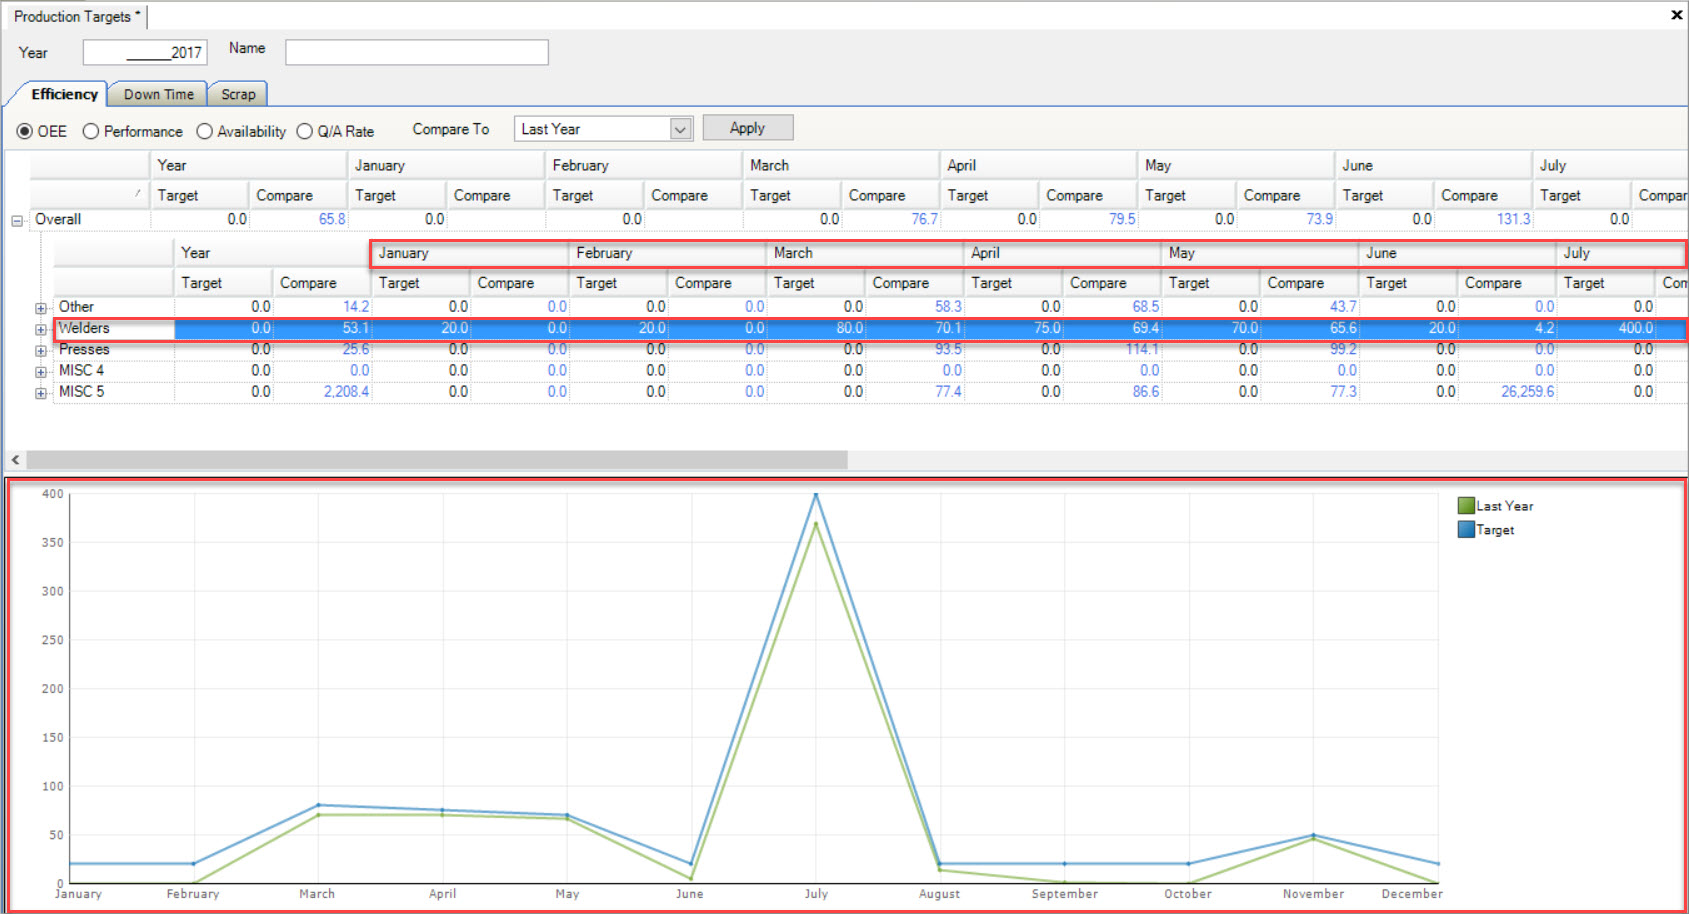
The graph below will display and compare the Efficiency Target to the Compare To option you selected.
The green line represents the Compare To option and the blue line represents the Target.
Targets by Workcenter
To create an Efficiency Target by Workcenter, users must select one of the options to view the Target by: OEE, Performance, Availability, or Q/A Rate.

Once users have selected an option to view the Overall Efficiency Target, use the drop-down menu located beside Compare To and select an option to compare your Target to. Options
include previous Target years created in the system such as the Last 12 Months, This Year, Last Year, and previous years. Once selected, click on the  button.
The Compare column below will be populated with the information in the system for both the Year and Month basis, if the information is available.
Expanding the plus sign to the left of the Overall row, will display the information by Workcenter Type, and by expanding the Workcenter Type, it will display the information for the individual Workcenters.
To compare Efficiency Targets by individual Workcenters, expand the Overall row. Each Workcenter Type will have Workcenters attached to them. Locate the Workcenter Type you wish to view the Workcenters for and click on the plus sign button again. The Workcenters for that Workcenter Type will be displayed.

On the graph located at the bottom of the screen, the option that you have selected from the Compare To drop-down menu, will be displayed by a green line.
Workcenter Targets by Year
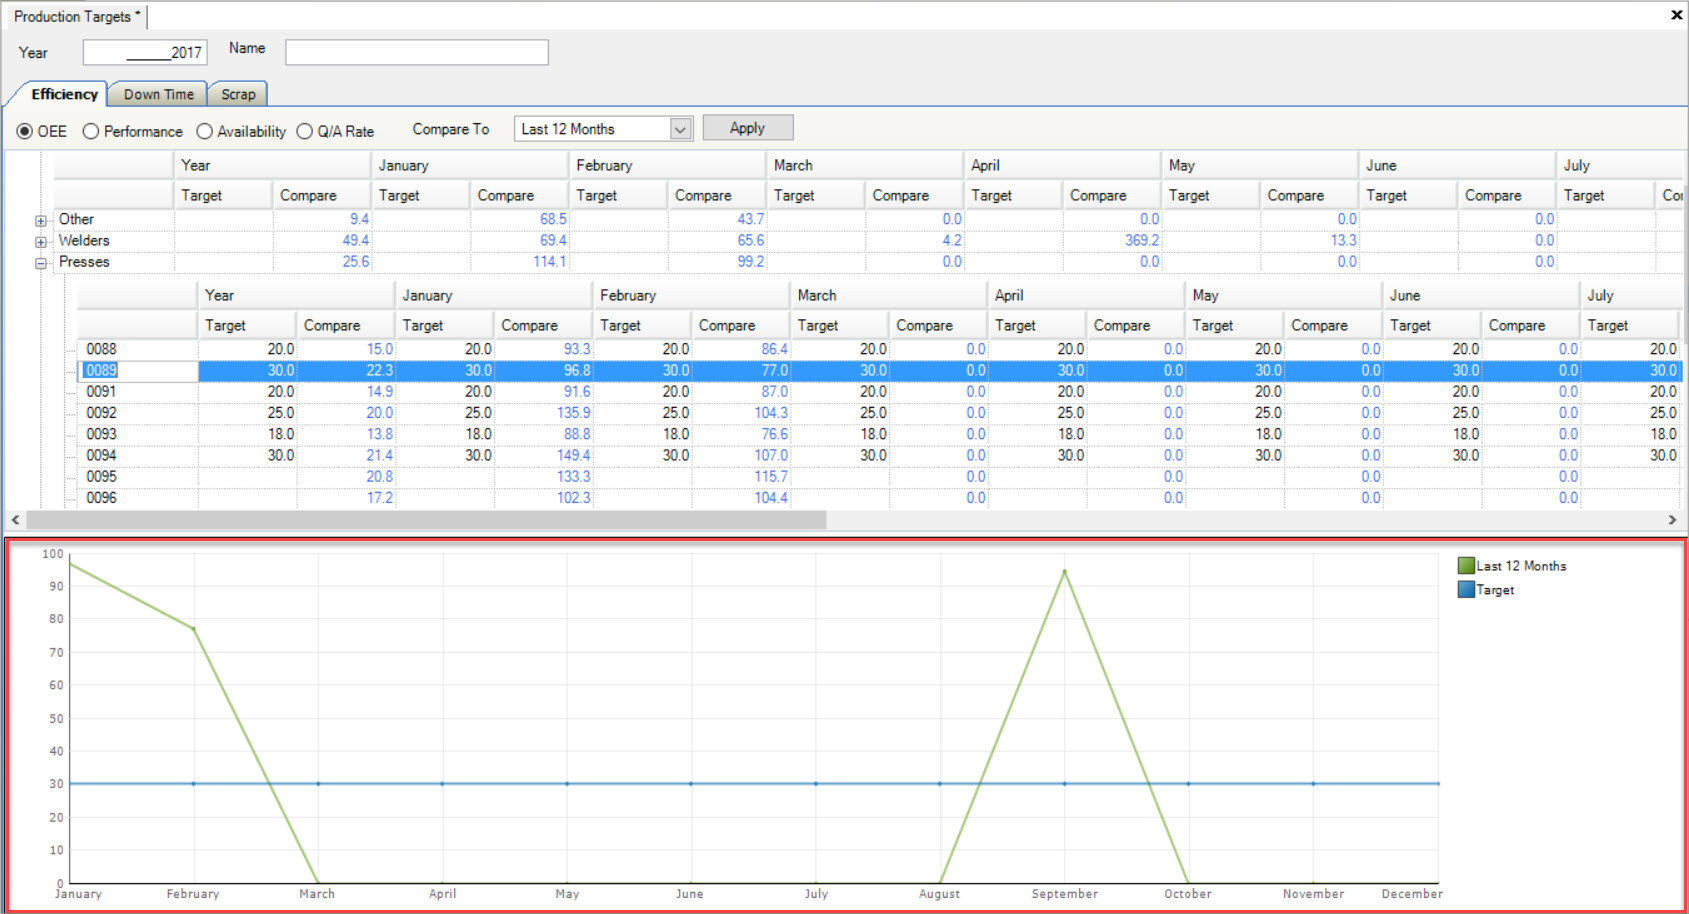
To compare Efficiency Targets by Workcenters by Year, users can enter in a Target in the Target column located below the Year column for each available Workcenter.

Once the Target has been entered, every Month will default to the same Target that was entered in for the Year, in the Target column for each Month.

The graph below will display and compare the Efficiency Target to the Compare To option you selected.
The green line represents the Compare To option and the blue line represents the Target.
Note
Users can only view one graph at a time for Workcenters.
Workcenter Targets by Month
To compare Efficiency Targets by Workcenters by Month, users can enter in a Target in the Target column located below each Month for each available Workcenter.

Once the Target has been entered in for each Month, the graph below will adjust accordingly.
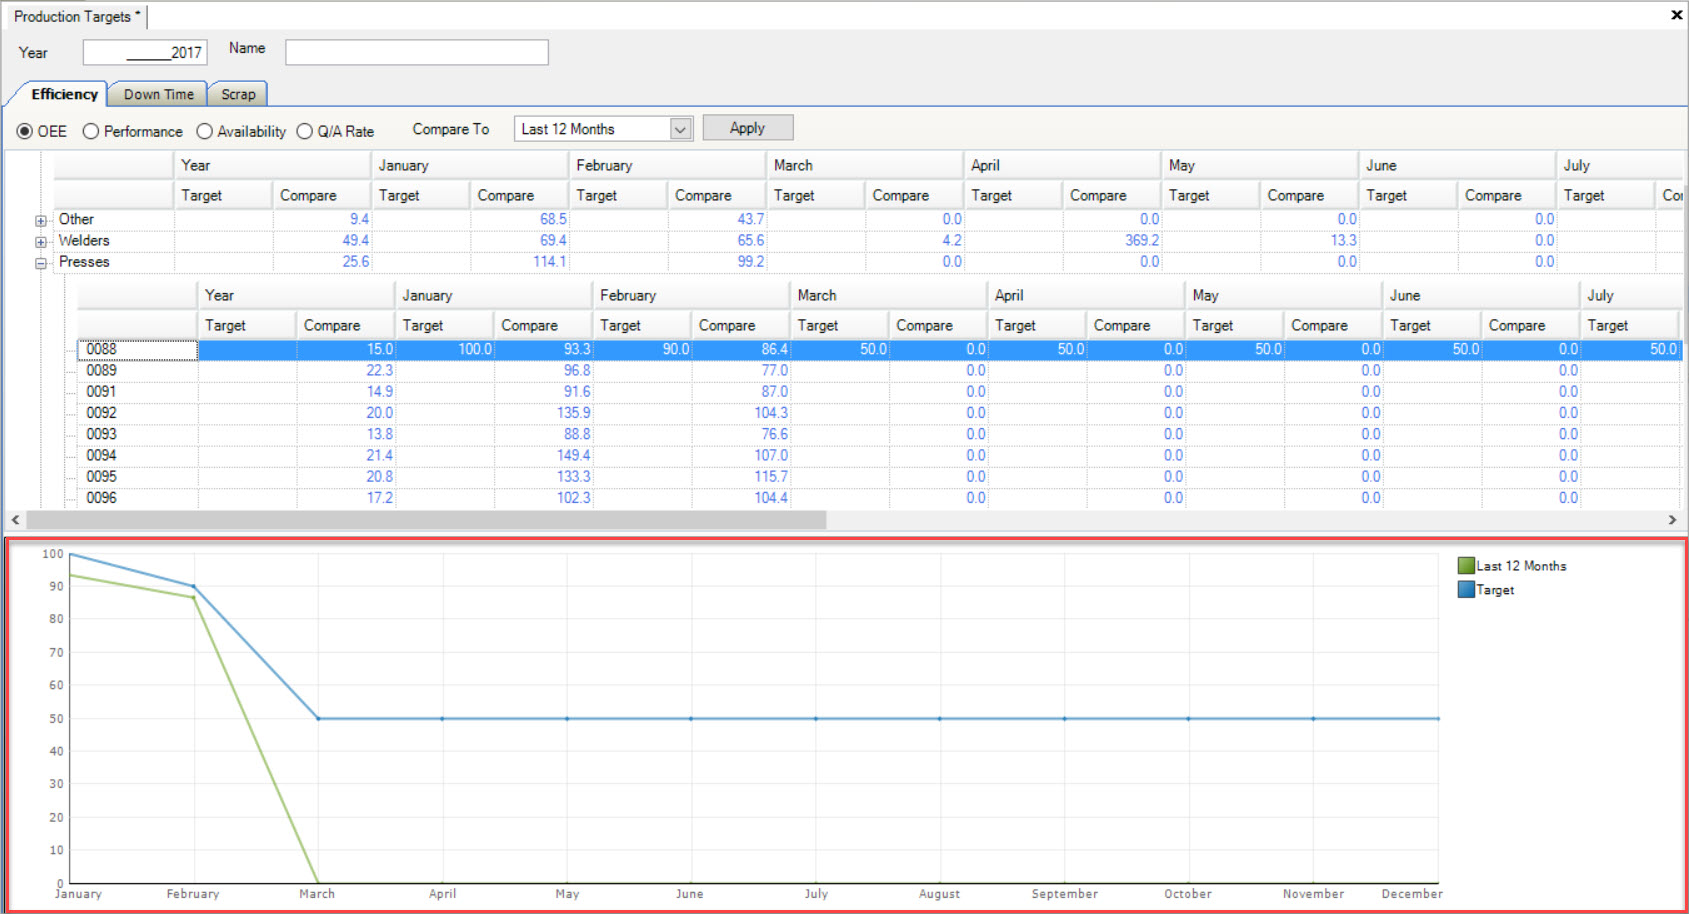
The graph below will display and compare the Efficiency Target to the Compare To option you selected.
The green line represents the Compare To option and the blue line represents the Target.